Demographics of the Czech Republic
This article is about the demographic features of the population of the Czech Republic, including population density, ethnicity, education level, health of the populace, economic status, religious affiliations and other aspects of the population.
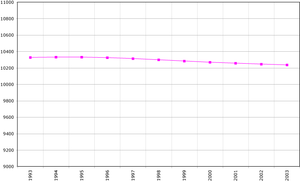
The majority of the 10.5 million inhabitants of the Czech Republic are ethnically and linguistically Czech (95%). Other ethnic groups include Germans, Roma, Poles and Hungarians. Historical minorities like those of Germans and Poles are declining due to assimilation. The Roma community is growing, while there is also a growing Vietnamese community. Other ethnic communities like Greeks, Turks, Italians and Yugoslavs are found in its capital city, Prague. Since the dissolution of Czechoslovakia, Slovaks staying in the Czech Republic have comprised roughly 3% of the population.
In 2007, immigration increased the population by nearly 1%. Total fertility rate is 1.50 children born/woman in 2008, climbing since the beginning of this decade.
Contents
|
Minorities

| Minority | 1991 Census[1] | 2001 Census[2] |
|---|---|---|
| Slovaks | 314,877 | 193,190 |
| Poles | 59,383 | 51,968 |
| Germans | 48,556 | 39,106 |
| Roma[3] | 32,903 | 11,746[3] |
| Hungarians | 19,932 | 14,672 |
| Ukrainians | 8,220 | 22,112 |
| Vietnamese | 421 | 17,462 |
Poles
The most concentrated linguistic minority in the Czech Republic are ethnic Poles, historically the majority, today constituting about 10% of the Karviná and Frýdek-Místek districts population. Poles have the right to use their language in official dealings, the public media (the Czech TV and the Czech Radio) regularly broadcast in Polish, and there are many Polish primary and secondary schools in the area. The Polish minority has been decreasing substantially since World War II as education in Polish was difficult to obtain, while Czech authorities did not permit bilingual signs to maintain Polish awareness among the population.
The erection of bilingual signs has technically been permitted since 2001, if a minority constitutes 10% of the population of a municipality. The requirement that a petition be signed by the members of minority was cancelled, thus simplifying whole process.[4] Still, only a couple of villages with large Polish minorities have bilingual signs (Vendryně/Wędrynia for instance).
Germans
The German minority of the Czech Republic, historically the largest minority of the country, was almost entirely removed when 3 million were forcibly expelled in 1945–6. Remaining Germans are granted some special rights in theory; however, the actual use of German in dealings with officials is usually not possible. There is no bilingual education system in Western and Northern Bohemia, where the German minority is mostly concentrated. However, this is in large part due to the absence of German-speaking youth, a heritage of the post-war policy of the Communist government.
According to the 2001 census there remain 13 municipalities and settlements in the Czech Republic with more than 10% Germans.
Many representatives of expellees' organizations support the erection of bilingual signs in all formerly German speaking territory as a visible sign of the bilingual linguistic and cultural heritage of the region, yet their efforts are not supported by some of the current inhabitants, as the vast majority of the current population is not of German descent.
Roma
Another minority is the Roma, who nonetheless have very little influence on Czech policy. Around 90% of the Roma that lived in the Czech Republic prior to World War II were exterminated by the Nazi Porajmos. The Roma there now are 80% post-war immigrants from Slovakia or Hungary, or the descendants thereof. In total, the Roma in the CR now number around 300,000.[5] There is Romani press in the CR, written in both Czech and Romani, but Romani radio is broadcast in Czech and there is no Romani television. Romani is also absent from legislative, judiciary, and other political texts but it has recently entered some university and elementary school courses. Life expectancy, literacy, median wage, school enrolment, and other socio-economic markers remain low while, according to Říčan (1998), Roma compose the majority of prison and habitual offender populations despite accounting for only a fraction of a percent of Czech population.
Greeks
Another influential minority are Greeks (including Macedonians or "Slavonic Greeks"). Large numbers of Greeks arrived in Czechoslovakia when the Greek Civil War broke out. The first transports of Greek children arrived in 1948 and 1949. Later, more transports, also including adults, arrived.[6] They were partly leftists, communists and guerillas with their relatives, hence the willingness of Czechoslovak government to allow the immigration.[7] This was viewed rather as a temporary solution. After the defeat of DSE and other left-wing guerillas, the Greeks stayed in Czechoslovakia. In total more than 12,000 Greeks immigrated to Czechoslovakia between 1948 and 1950.[7] Today, there are about 7000 Greeks in the country (3219 according to 2001 census data),[7] mostly in the 3 biggest towns – Prague, Brno, Ostrava – and also in Bohumín, Havířov, Jeseník, Karviná, Krnov, Šumperk, Třinec, Vrbno pod Pradědem and Žamberk (most of these towns are in the Moravian-Silesian Region).[8]
Vietnamese
There are also Asian minorities in the Czech Republic. The largest is the Vietnamese one. During the communist era the governments of Czechoslovakia and Vietnam had a deal concerning the education of Vietnamese people in Czechoslovakia. Vietnamese people came to Czechoslovakia for the first time in 1956 and then the number of new migrants grew until the fall of communism. First generation Vietnamese work mostly as small-scale businessmen in markets. Still, many Vietnamese are without Czech citizenship. One of the towns with the largest Vietnamese communities is Cheb.
Religion
Most of the Czech population claim to be atheist, agnostic, non-believer or no-organized believer (59%). The largest denomination is Roman Catholicism, estimated at 27.4% of the population.[2]
According to the most recent Eurobarometer Poll 2005,[9] 19% of Czech citizens responded that "they believe there is a god", whereas 50% answered that "they believe there is some sort of spirit or life force" and 30% that "they do not believe there is any sort of spirit, god, or life force", the lowest rate of EU countries after Estonia with 16%.[10]
CIA World Factbook demographic statistics
The following demographic statistics are from the CIA World Factbook, unless otherwise indicated.
Population
10,501,197 (30.9.2009 est.)
- There were 119,600 births and 104,900 deaths in 2008. [11]
Age structure
2007
0–14 years: 14.2% (male 758,305; female 718,618)
15–64 years: 71.2% (male 3,726,148; female 3,665,225)
65 years and over: 14.6% (male 598,481; female 914,353)
2006
0–14 years: 14.4% (male 760,065; female 719,449)
15–64 years: 71.2% (male 3,683,215; female 3,642,023)
65 years and over: 14.4% (male 582,904; female 899,533)
2005
0–14 years: 14.7% (male 773,028; female 731,833)
15–64 years: 71.1% (male 3,651,018; female 3,627,006)
65 years and over: 14.2% (male 565,374; female 892,879)
2004
0–14 years: 14.9% (male 784,186; female 742,760)
15–64 years: 71.0% (male 3,638,782; female 3,620,219)
65 years and over: 14.0% (male 557,945; female 876,685)
2003
0–14 years: 15.2% (male 797,847; female 756,628)
15–64 years: 70.8% (male 3,625,092; female 3,608,696)
65 years and over: 13.9% (male 551,801; female 871,391)
Population growth rate
+0.41% (2009 est.)
+0.83% (2008 est.)
+0.91% (2007 est.)
+0.35% (2006 est.)
+0.30% (2005 est.)
+0.09% (2004 est.)
+0.08% (2003 est.)
−0.03% (2002 est.)
−0.25% (2001 est.)
+0.72% (1974 est.)
Birth rate
11.30 births/1,000 population (2009 est.)
11.52 births/1,000 population (2008 est.)
11.16 births/1,000 population (2007 est.)
10.28 births/1,000 population (2006 est.)
10.00 births/1,000 population (2005 est.)
9.57 births/1,000 population (2004 est.)
9.18 births/1,000 population (2003 est.)
9.10 births/1,000 population (2002 est.)
8.87 births/1,000 population (2001 est.)
19.55 births/1,000 population (1974 est.)
Death rate
10.19 deaths/1,000 population (2009 est.)
10.10 deaths/1,000 population (2008 est.)
10.16 deaths/1,000 population (2007 est.)
10.15 deaths/1,000 population (2006 est.)
10.56 deaths/1,000 population (2005 est.)
10.50 deaths/1,000 population (2004 est.)
10.91 deaths/1,000 population (2003 est.)
10.61 deaths/1,000 population (2002 est.)
10.54 deaths/1,000 population (2001 est.)
12.69 deaths/1,000 population (1974 est.)
Net migration rate
2.70 migrant(s)/1,000 population (2009 est.)
6.92 migrant(s)/1,000 population (2008 est.)
8.14 migrant(s)/1,000 population (2007 est.)
3.37 migrant(s)/1,000 population (2006 est.)
3.54 migrant(s)/1,000 population (2005 est.)
1.83 migrant(s)/1,000 population (2004 est.)
2.53 migrant(s)/1,000 population (2003 est.)
1.20 migrant(s)/1,000 population (2002 est.)
−0.84 migrant(s)/1,000 population (2001 est.)
0.31 migrant(s)/1,000 population (1974 est.)
Sex ratio
at birth: 1.06 male(s)/female
under 15 years: 1.06 male(s)/female
15–64 years: 1.01 male(s)/female
65 years and over: 0.65 male(s)/female
total population: 0.96 male(s)/female (2007 est.)
Infant mortality rate
2.83 deaths/1,000 live births (2008 est.)
Life expectancy at birth
total population: 77.08 years
male: 74.0 years 74,0
female: 80.1 years (2005 est.)
Total fertility rate
1.49 children born/woman (2009)
Nationality
noun: Czech(s) (Czech language: Čech, plural: Češi)
adjective: Czech (česká)
Ethnic groups
Czech 90.4%, Moravian 3.7%,[12] Slovak 1.9%, Polish 0.5%, German 0.4%, Silesian 0.1%,[12] Roma 0.1% (those officially claiming so, unofficial estimate is cca. 2%), Hungarian 0.1%, other 2.8% (March 2001)
- Ukrainians are the largest group of people without Czech citizenship living in the country.
Religions
Atheist and agnostic 60.0%, Roman Catholic 27.4%, Protestant 1.2%, Hussites 1.0%, Jehovah's Witnesses 0.2%, Eastern Orthodox 0.2%, other religions 2.8%, unknown 8.8% (March 2001)
Languages
Czech, also in some regions Moravian dialects, Cieszyn Silesian dialect and Polish language in Těšínské Slezsko as well as various Sudeten German dialects that are currently in extreme danger of extinction.
Literacy
definition: NA
total population: 99.9% (1999 est.)
male: NA%
female: NA%
External links
- Czech Statistical Office, state institution responsible to provide official data about Czech Republic
- Ethnic groups living in the Czech Republic (click on menu for others)
References
- ↑ Czech Statistical Office
- ↑ 2.0 2.1 Czech Statistical Office
- ↑ 3.0 3.1 In census people can leave the "nationality" field empty and they can also write down any nationality or ethnicity they want. Most of Roma people fill in the Czech nationality. Thus, the real number of Roma in the country is estimated to be around 220,000. Petr Lhotka: Romové v České republice po roce 1989
- ↑ Kongres Polaków w RC, 29.10.2006
- ↑ http://ec.europa.eu/education/languages/archive/languages/langmin/euromosaic/cz3_en.html
- ↑ Anthula Botu: Řekové v českých zemích 1948-2000
- ↑ 7.0 7.1 7.2 Marián Sloboda: „Až bude v Řecku mír, vrátíme se domů“. Řecká národnostní skupina v České republice, 25.3.2003
- ↑ Vangelis Liolios: Podkladové materiály pro Radu vlády pro národnostní menšiny o situaci řecké menšiny v České republice
- ↑ "Eurobarometer on Social Values, Science and technology 2005 - page 11" (PDF). http://ec.europa.eu/public_opinion/archives/ebs/ebs_225_report_en.pdf. Retrieved 2007-05-05.
- ↑ "Social values, Science and Technology" (PDF). Eurobarometer. June 2005. http://ec.europa.eu/public_opinion/archives/ebs/ebs_225_report_en.pdf. Retrieved 2006-12-19.
- ↑ http://www.czso.cz/csu/csu.nsf/informace/coby031309.doc
- ↑ 12.0 12.1 The Moravians and Silesians, lacking significant differences in cultural traditions and ethnic or language characteristics from the Czechs, are officially not forming a minority (in political sense) and their percentages are often added to the one of Czechs. The results here reflect the right of anybody to identify him-/herself with any nationality or ethnic group, as stated in the Universal Declaration of Human Rights.
|
||||||||||||||